COMMUNICATION 1

INTRODUCTION

In the first article I started to describe what is Industry 4.0, giving importance, in addition to all the aspects that cover this new industrial revolution, to communication. In fact, all the gills that Industry 4.0 covers, without an interconnection between systems, therefore communication, Industry 4.0 and everything it entails is not possible.

We need to gather data from various devices and/or machines in order to analyze and to forecast their behavior. Without communication, stable and reliable, this in not possible.

In this article and in the nexts, I will begin an analysis of how electronic systems communicate, on what basis digital communication is based today. I will make a short story to introduce how communication protocols and standards were born. Today’s communication starts and is based on the ISO/OSI system, but before going into the study of this system, let’s see how the systems communicate.

SHORT AND INACCURATE HISTORY OF COMMUNICATION

This is not intended to be a detailed history of communication, but only a brief introduction.

Communication has always been the basis of the development of our civilization. At the beginning the communication was only verbal, then it started to be fixed on stone, with the rock drawings of the Neolithic

then on wax tablets and also the first begin remote communication with smoke or fire signals and with drums

later it was discovered the telegraph, Morse code, the phone, and from the phone discovery we can say that came the communication modern , with the transmission of voice, images, music and videos.

COMMUNICATION BETWEEN CALCULATORS[1]

Speaking of industry 4.0 we talk about communication between electronic devices. Electronic devices communicate mainly with two types of connections, parallel and serial. In the parallel communications the physical layer are constituted by a number of lines or wires, equal to the number of bits needed to form the information to be transmitted, on each line one bit. In the serial communications the physical layer is made up of a single line and the bits that make up the information are sent in sequence. Both of these communications need synchronization so that the receiver can recognize the information it receives.

Parallel communications for the moment we leave them aside and perhaps we will resume them later in more detail, here we will continue with serial communications as all communications are serial. Serial communications are less expensive than parallel ones since they take up less space both at the circuit level and at the overall level and therefore the infrastructures to support this technology have smaller overall dimensions.

Serial connections are divided into two groups, synchronous transmissions and asynchronous transmissions. Asynchronous transmissions are characterized by a line maintained at logic level 1, until data is transmitted. Before each set of data, the line is brought to logic level 0 for a period of time corresponding to a bit, this signals to the receiver the start of a data transfer and allows synchronization between source and receiver. The duration of the bit is known (both to the transmitter and to the receiver) as a transmission speed is defined. At the end of the message the line is brought to logic level 1 for a period of time equal to a certain number of bits.

In the synchronous transmissions, synchronization is given by a clock signal inherent in the data packet, which is pic\ked up by a special circuit called phase locking circuit. This technique is the most efficient and most suitable for high speeds.

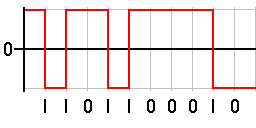
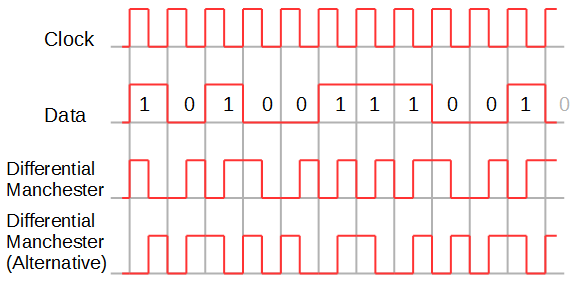
For data transmission there are various encodings, all created to simplify the encoding and decoding circuits, and the most famous or better those that have spread most are:

bipolar encoding or NRZ-L: the logical zero level is the high voltage level and vice versa

NRZI coding: logic level 1 corresponds to a voltage transition, while zero corresponds to no transition
Manchester coding: the voltage transition occurs within the time interval of the bit: 1 rising edge, 0 falling edge
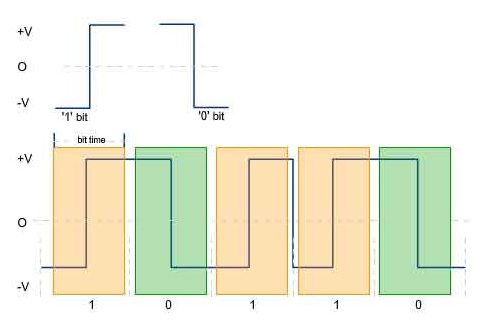
Manchester differential coding: the transition takes place in the center of the bit time interval. The 0 corresponds to this transition, while the one is absent from this transition
Key features and issues of networks [2]

What characterizes a network are the following attributes

TOPOLOGY topology refers to the way in which the various stations or nodes in the network are connected

CIRCUIT SWITCHING AND PACKAGE SWITCHING NETWORKS the connection between two or more nodes can be done in two ways , usually:

– circuit-switched networks, in which a physical communication channel is established through the network, between sender and receiver

– packet-switched networks, in which messages are broken up into packets and transmitted across the network, to the recipient

CONTROL OF ACCESS TO THE TRANSMISSIVE CHANNEL In circuit-switched networks it is necessary to provide mechanisms that allow each user to request a connection to the desired partner. While for packet-switched networks in which all users are connected to a single transmission channel, the problem arises from time to time which of the users has the right to use the channel and to resolve any conflicts.

ROUTING OF MESSAGES In packet-switched networks there is the problem of establishing the path of packets within the network.

INTERCONNECTION BETWEEN DIFFERENT NETWORKS To solve this problem we need to rely on additional devices that take a different name depending on the number of ISO / OSI levels they implement.

CONCLUSIONS

Up to this point we have only made an overview of the various methods of creating a computer network. An overview necessary to be able to introduce the next articles that will analyze in more detail the ISO / OSI model and the internet, which we all know. This was necessary because there are many proprietary and non-proprietary communication methods or protocols in the industry, so we need to understand how to interface the various networks and collect or exchange the data we need . Given that Industry 4.0 is an innovation that gives the possibility of sharing and processing data, it is necessary to understand how these network architectures are born in order to connect them to each other. In this the ISO / OSI model helps us, which we will begin to see in the next articles.

BIBLIOGRAPHY – SITOGRAPHY

  • [1] Engineer’s manual – New Colombo 84th edition – Third volume – Section N – Page 181
  • [ 2 ] Engineer’s manual – New Colombo 84th edition – Third volume – Section N – Page 186

REVISIONS

  • 13 APRIL 2020 Publication
DIAGNOSTICS 2

INTRODUCTION

In the previous article we came to define that the vibrations generated by a device or a machine are a source of information on the current state and that it is possible to identify faults through them. In this article we will analyze the vibrations from what and why they are generated and we will try to get a diagnosis through their analysis.

VIBRATIONS OF AN ELECTRIC MACHINE [ 1 ]

The main areas of vibration in rotating electrical machines are:

  • Response of the stator core to the attractive force developed between stator and rotor
  • Response of the heads of the stator windings to the electromagnetic forces in the conductors
  • Rotor dynamic behavior
  • Response of the shaft bearings to the vibration transmitted by the rotor

Electromagnetic forces

Most electrical machines base their operation on two principles:

  • The force exerted on a conductor crossed by an electric current and immersed in a magnetic field (Lorentz Force)
  • The force produced by ferromagnetic structures traversed by a magnetic flux (Maxwell Force)

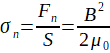
The force that tends to close the gap between two blocks of ferromagnetic material is defined as the radial force of the Maxwell tensor. The Maxwell tensor represents the electromagnetic forces that concur in a rotating machine and are perpendicular to the stator and to the rotor and symmetric, therefore with resultant zero. The perfect symmetry can occur if and only if the rotor and stator are perfectly concentric, so ideals. The Maxwell tensor can be represented in terms of magnetic induction ( B ) as follows:

In the next lines there is the demonstration that the main vibration frequency of an electric motor is double the power frequency, so the following pages are the mathematical demonstration of this assertion.

The magnetic flux Φ is given by the magnetomotive force M divided by the reluctance of the magnetic circuit (figure a)

given that the reluctance of the air gap is much higher than that of the iron core, as a first approximation we tend to neglect this reluctance of the core in calculating the magnetomotive force necessary to produce a given flow of magnates Φ .

The reluctance to the air gap is (formule b)

where is it

  • δ is the length of the air gap [m ]
  • μ0 is pe r magnetic vacuum permeability [H / m ]
  • S is the normal surface through which the flow passes [m2]

the flow Φ is given by the flux density d ell’induzione magnetic B that crossed in a perpendicular surface S (formula c)

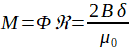
putting together the previous formulas [a, b and c] is obtained

The main harmonic component of the magnetomotive force M, has a sinusoidal spatial distribution to the air gap, with a period that depends on the number of pairs of poles pp and amplitude variable sinusoidally over time as a function of the feeding frequency f

where is it

As a consequence the field B will have the same behavior and its first harmonic

Formula of magnetic induction

The radial component of the Maxwell tensor is proportional to the square of B, so raising the expression of B to the square

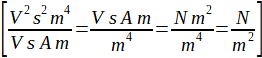
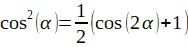
we remember that

It should be noted that the radial component due to the Maxwell tensor has a sinusoidal component over time with a frequency twice the power frequency.

To which the main frequency of the stator case vibration is twice the power supply frequency, even when the rotor and stator are perfectly c or ncentrici.

In conditions of perfect symmetry between rotor and stator, if we integrate the Maxwell effort along the entire air gap we get that both the horizontal and vertical components are null. So we have to go and check in case of eccentricity

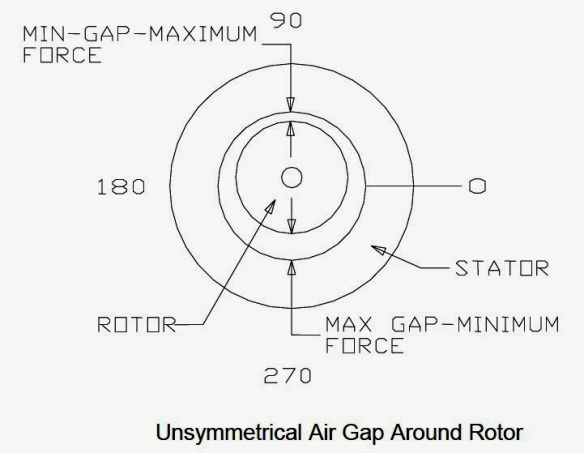
Static eccentricity

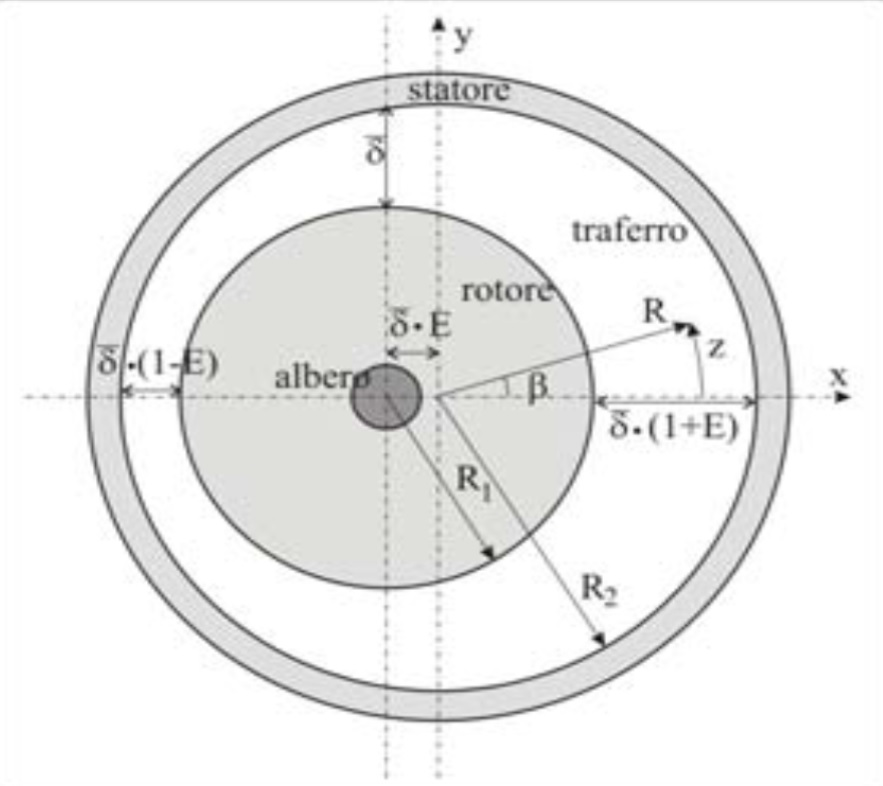
This is the situation in which the rotor axis is not in axis with the stator axis

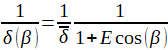
Since the rotor is symmetrical to its axis we have no mechanical unbalance. In this case the length of the air gap can be expressed

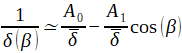
in the expression of magnetic induction we have that the length of the air gap is a denominator, so we must calculate the inverse

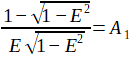
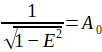
proves that

placing

Knowing that you get it

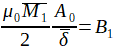
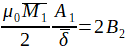
from this we can calculate the magnetic induction due to static eccentricity

placing

remembering that

you get

the induction to the air gap, in the presence of static eccentricity, is due to the interaction of three harmonics with different numbers of pairs of poles

this is the field with pp pairs of poles as in the concentric rotor

in the next two formulas for greater readability we have collected β

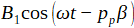
the field with ( pp -1) pairs of poles
the field with ( pp +1) pairs of poles

By integrating the Maxwell effort along the air gap, a resultant different from zero is obtained in the direction of the minimum air gap. So with static eccentricity there is an increase of the double vibration compared to the power frequency.

Dynamic eccentricity

the dynamic eccentricity is the case in which the rotor rotates around the axis of the stator and not to its own axis. Not coincident, it also has a mechanical unbalance, which can be expressed as a centrifugal force that rotates at the speed of the rotor. The air gap rotates at the speed Ω , so its length can be expressed as follows

the dynamic eccentric produces a rotating electromagnetic force at the rotor speeds Ω , which is added to that due to mechanical unbalance.

Following the same reasoning static eccentricity can be calculated by the expression magnetic induction B and the Maxwell tensor which is proportional to the square of B . It is found that dynamic eccentricity also produces vibrations at frequencies

having fs is the stator frequency and f r is the rotor frequency. Where in the asynchronous engines we will have

while in synchronous engines we will have

Methods to diagnose eccentricity

Asynchronous Motors

We see in the previous paragraphs that the amplitudes of the vibration harmonics 2fs , fr , 2fs ±fr

  • it increases rapidly with eccentricity (static and dynamic) especially when empty
  • static eccentricity has only a small influence on the frequency component fr

The amplitudes of the current harmonics at frequency fs±f r

  • their amplitude is strongly dependent on the degree of eccentricity both static and dynamic
  • the effect of dynamic eccentricity increases passing from the nominal load to the empty operation

To diagnose the rotor eccentricity in asynchronous cage motors, other current harmonics have been considered, which also depend on the number of rotor bars.

Synchronous generators

The current harmonics are at frequency 5fs , 7fs, 11fs , 13fs , 17fs , 19fs , their amplitude increases with the dynamic eccentricity for both types of rotor (smooth poles, salient poles).

Brushless motors

the amplitude of the radial force components and consequently the vibration harmonics increases with the dynamic eccentricity. Increases more in internal magnet motors than in surface magnet motors. Because the different position of the magnets creates a different distribution of the magnetic flux in the iron.

Conclusions

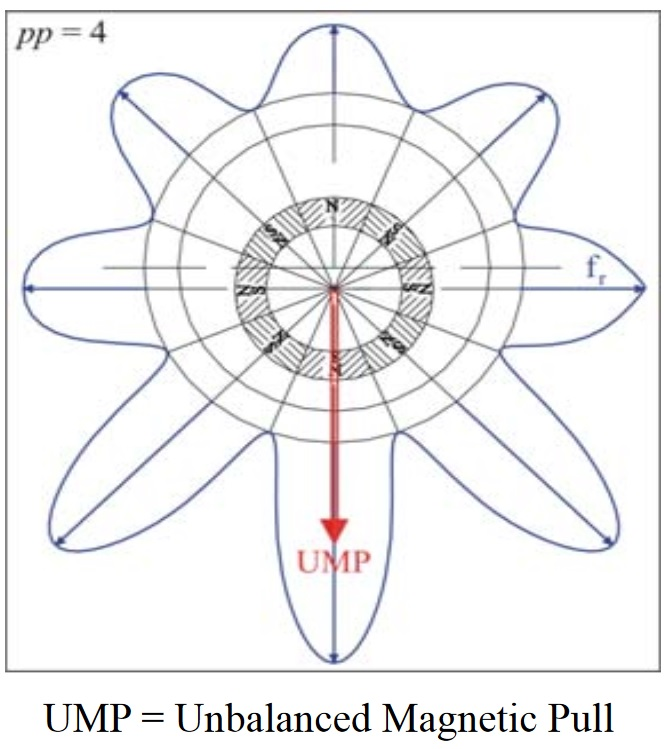
The eccentricity causes an unbalanced electromagnetic force on the rotor, called Unbilanced Magnetic Pull (UMP), which tries to move the rotor further. This can cause an increase in bearing wear. Furthermore the forces due to eccentricity subject the stator windings to potentially damaging vibrations. A high UMP can cause the rotor to rub on the stator.

Here I conclude, we focused mainly on the analysis of vibrations, as vibration analysis is the most widespread technique at the moment and allows us to diagnose a possible eccentricity of the rotor. I do not continue with diagnostics as the next points of analysis are not the subject of the current development of these pages. In the next articles we will address other topics of industry 4.0 such as communication, the management of the large amount of data generated by the various sensors present in a plant, for monitoring the status.

It should be noted that all the proofs are linear equations, but as we already know from the sixties, nature is certainly not a linear equation. A famous engineer said: God could not be more rude to use non-linear equations [2]. This is to anticipate that all the empirical results that we will find will always depart from the theory.It should be noted that all the proofs are linear equations, but as we already know from the 60s, nature is certainly not a linear equation. A famous engineer said: God could not be more rude to use non-linear equations [2]. This is to anticipate that all the empirical results that we will find will always depart from the theory.

BIBLIOGRAPHY – SITOGRAPHY

  • [ 1 ] Vibration analysis 2 by Lucia Frosini, professor at the University of Pavia
  • Does God Play Dice? The New Mathematics of Chaos

REVISIONS

  • 25 December 2019 Publication

DIAGNOSTICS

INTRODUCTION

With the article on Industry 4.0 it has been said that data analysis can prevent sudden machine downtime and therefore provide for repairs or replacements at times more suited to production.

Much of the theory of the industry 4.0 is based on an analysis of data, coming from various sensors distributed in the plant or in the machine, from this analysis comes a prediction about possible failures or downtime. Without a study or without having the basics of diagnostics and maintenance, even the best programmer / software will not be able to predict the deterioration of a given component. In this article, I will try to introduce the concept of diagnostics and maintenance, trying to maintain a general line so as to be able to cover the greatest number of cases.

DIAGNOSTICS

[1] Diagnostics: it is a translation procedure, of the information deriving from the measurement of the parameters and from the collection of data relating to the machine, in information on the actual or incipient failures of the machine itself. The diagnostics is a fault protection, that is, it activates when the fault has occurred, which is why in optical 4.0 it is necessary to transform the protection into prevention, but to perform this step it is necessary to understand the principles of diagnosis and maintenance.

[1] Here we start talking about preventive maintenance, which has some shortcomings:

– for obvious economic reasons maintenance interventions cannot be frequent

– during the revision phases, we try to carry out all possible repairs and replacements, even those that are not necessarily necessary. Increasing costs and times during these maintenance phases.

To solve these economic defects and at the same time maintain an efficient machine we must start talking about predictive diagnosis. This term means having the actual status of each component in order to predict or determine with a high degree of reliability, when the component can break, giving the possibility to plan targeted interventions and therefore to reduce maintenance costs.

DIAGNOSTICS OF ROTATING MACHINES

[ 2 ] We begin by analyzing the motors and their causes of failure, this is because the motors are present in all industrial automation and therefore one of the main causes of plant malfunctioning. In addition, knowing the main causes of failure it will be possible to have more accurate diagnoses.

Where can faults occur in an engine?

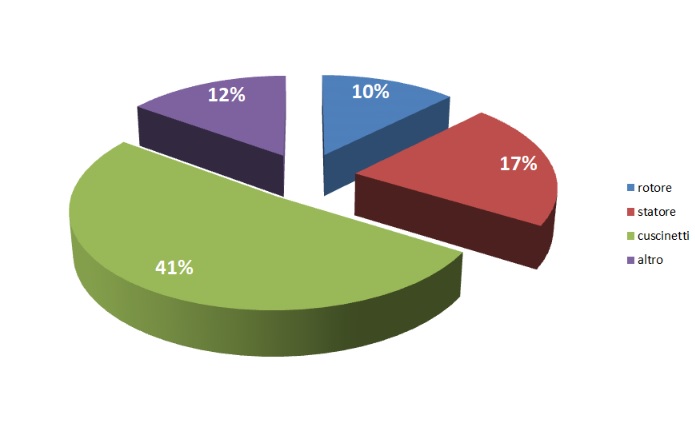
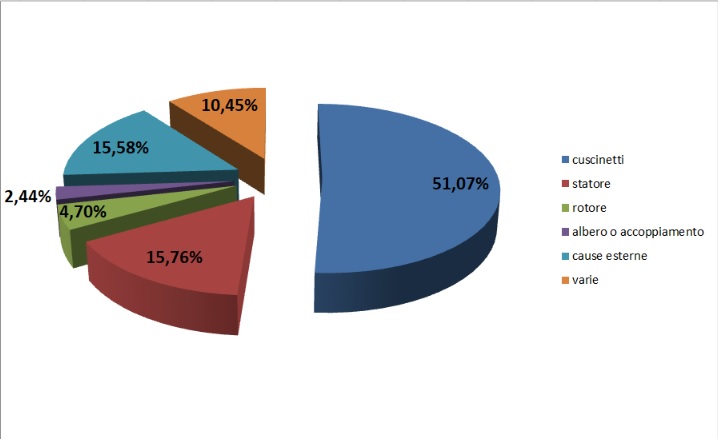
this argument is not easy to develop, as there is not much in the literature, and the little that is found is dated. Here I report a couple of studies, cited by professor Lucia Frosini of the University of Pavia, in her slides, you can find the link at the bottom of the article. The studies to which it refers are, one of EPRI (Electric Power Research Institute), the study is done on a sample of 5000 motors (in direct current and alternating current) used in different environments and applications with powers greater than 150kW, the greater part of them are asynchronous motors powered at a voltage greater than 1000V. This investigation was carried out in 1985. The other study is from 1995, and was carried out in the oil sector in Norway and concerns engines located in outdoor environments and with powers greater than 10kW and voltages lower than 1000V. The results of the two surveys are partially different, due to the size of the engines and the environment of use. The causes behind the failures are not easy to aggregate, but it can be deduced that the main causes are improper use, defective components and inadequate maintenance. In the following two graphs you can see the main components that are subject to failures.

CONCLUSION OF EPRI INVESTIGATION

 CONCLUSIONS NORWAY SURVEY

I make a clarification, in the second investigation is not explained the title “External device”, in the diagram I called “cause esterne”, so we can not assume anything about it. But what catches one’s eye is that in both studies the majority of failure cases are due to the bearings and stator windings.

A little while ago I mentioned the possible causes of the failures, improper use, defective components and inadequate maintenance. The first two causes will not be analyzed because they are outside the scope of this article, as they can be traced back to design errors. What I will analyze is inadequate maintenance. The meaning of this cause has as its main meaning an incorrect analysis of the problem, which involves an incorrect repair or maintenance action. Even in the industry 4.0 there can be these deficiencies, because the analysis is always performed by man and possible errors can be there, but with historical data and detailed analysis these errors can be reduced, and to achieve this we must mention artificial intelligence , which will be introduced in the next articles. The basic concept, to start analyzing any failures, is that when a motor or component is about to break down, there are warning signals that, if collected and analyzed, can prevent unexpected downtime. So the question is what should we analyze to see if a component is breaking? In an electric machine there are various aspects to be analyzed, electrical, magnetic, mechanical, fluid dynamic and thermal, and all interact with each other and therefore various fault indicators can be distinguished.

Electromagnetic indicators:

  • current
  • tensions
  • partial discharges
  • magnetic fluxes

mechanical indicators:

  • noise
  • angular speed
  • power
  • couple

thermal and chemical indicators:

  • temperature
  • oil and gas analysis

then we can measure the efficiency or the visual analysis, but among all the possible analyzes the most used is the measurement of the vibrations.

The vibrations are indicative of the forces generated by the motion of the rotor, in a rotating electric machine, especially due to its unbalance. Vibration analysis is aimed at identifying not only mechanical problems, but also electrical problems as an electrical anomaly produces an asymmetry in the distribution of the magnetic flux to the air gap and determines a variation in the dispersed flow, which produces a different distribution of forces electromagnetic and affects the progress of vibrations. For this reason, detection can also be useful on the motor casing. From this first approach it is clear that the machine’s vibrations change in the presence of faults. Unfortunately, they are not easy to identify because they are masked by other vibrations outside the machine itself. In any case, the analysis techniques of vibration signals have been developed to selectively highlight which parts can be subject to breakdowns or malfunctions, and based on the frequencies it is possible to determine what the failure could be. In determining whether a given frequency is due to a fault, we must begin to discern the various frequencies, especially the natural vibrations, which mask those vibrations that highlight a malfunction. Each machine produces its own vibrations, due to its mechanical characteristics, so it is necessary to eliminate all these frequencies to be able to determine a vibration that identifies a fault.

CONCLUSIONS

This concludes the first part of this long chapter, I decided to divide it into several parts in order to render easy to read. In the second parts, the analysis of the vibrations will be deepened to determine the faults and then the main causes of faults in rotating machines will be introduced.

BIBLIOGRAPHY – SITOGRAFIA

REVISIONS

  • 11 OCTOBER 2019 Publication
  • 25 DECEMBER 2019 Link to follow articles update